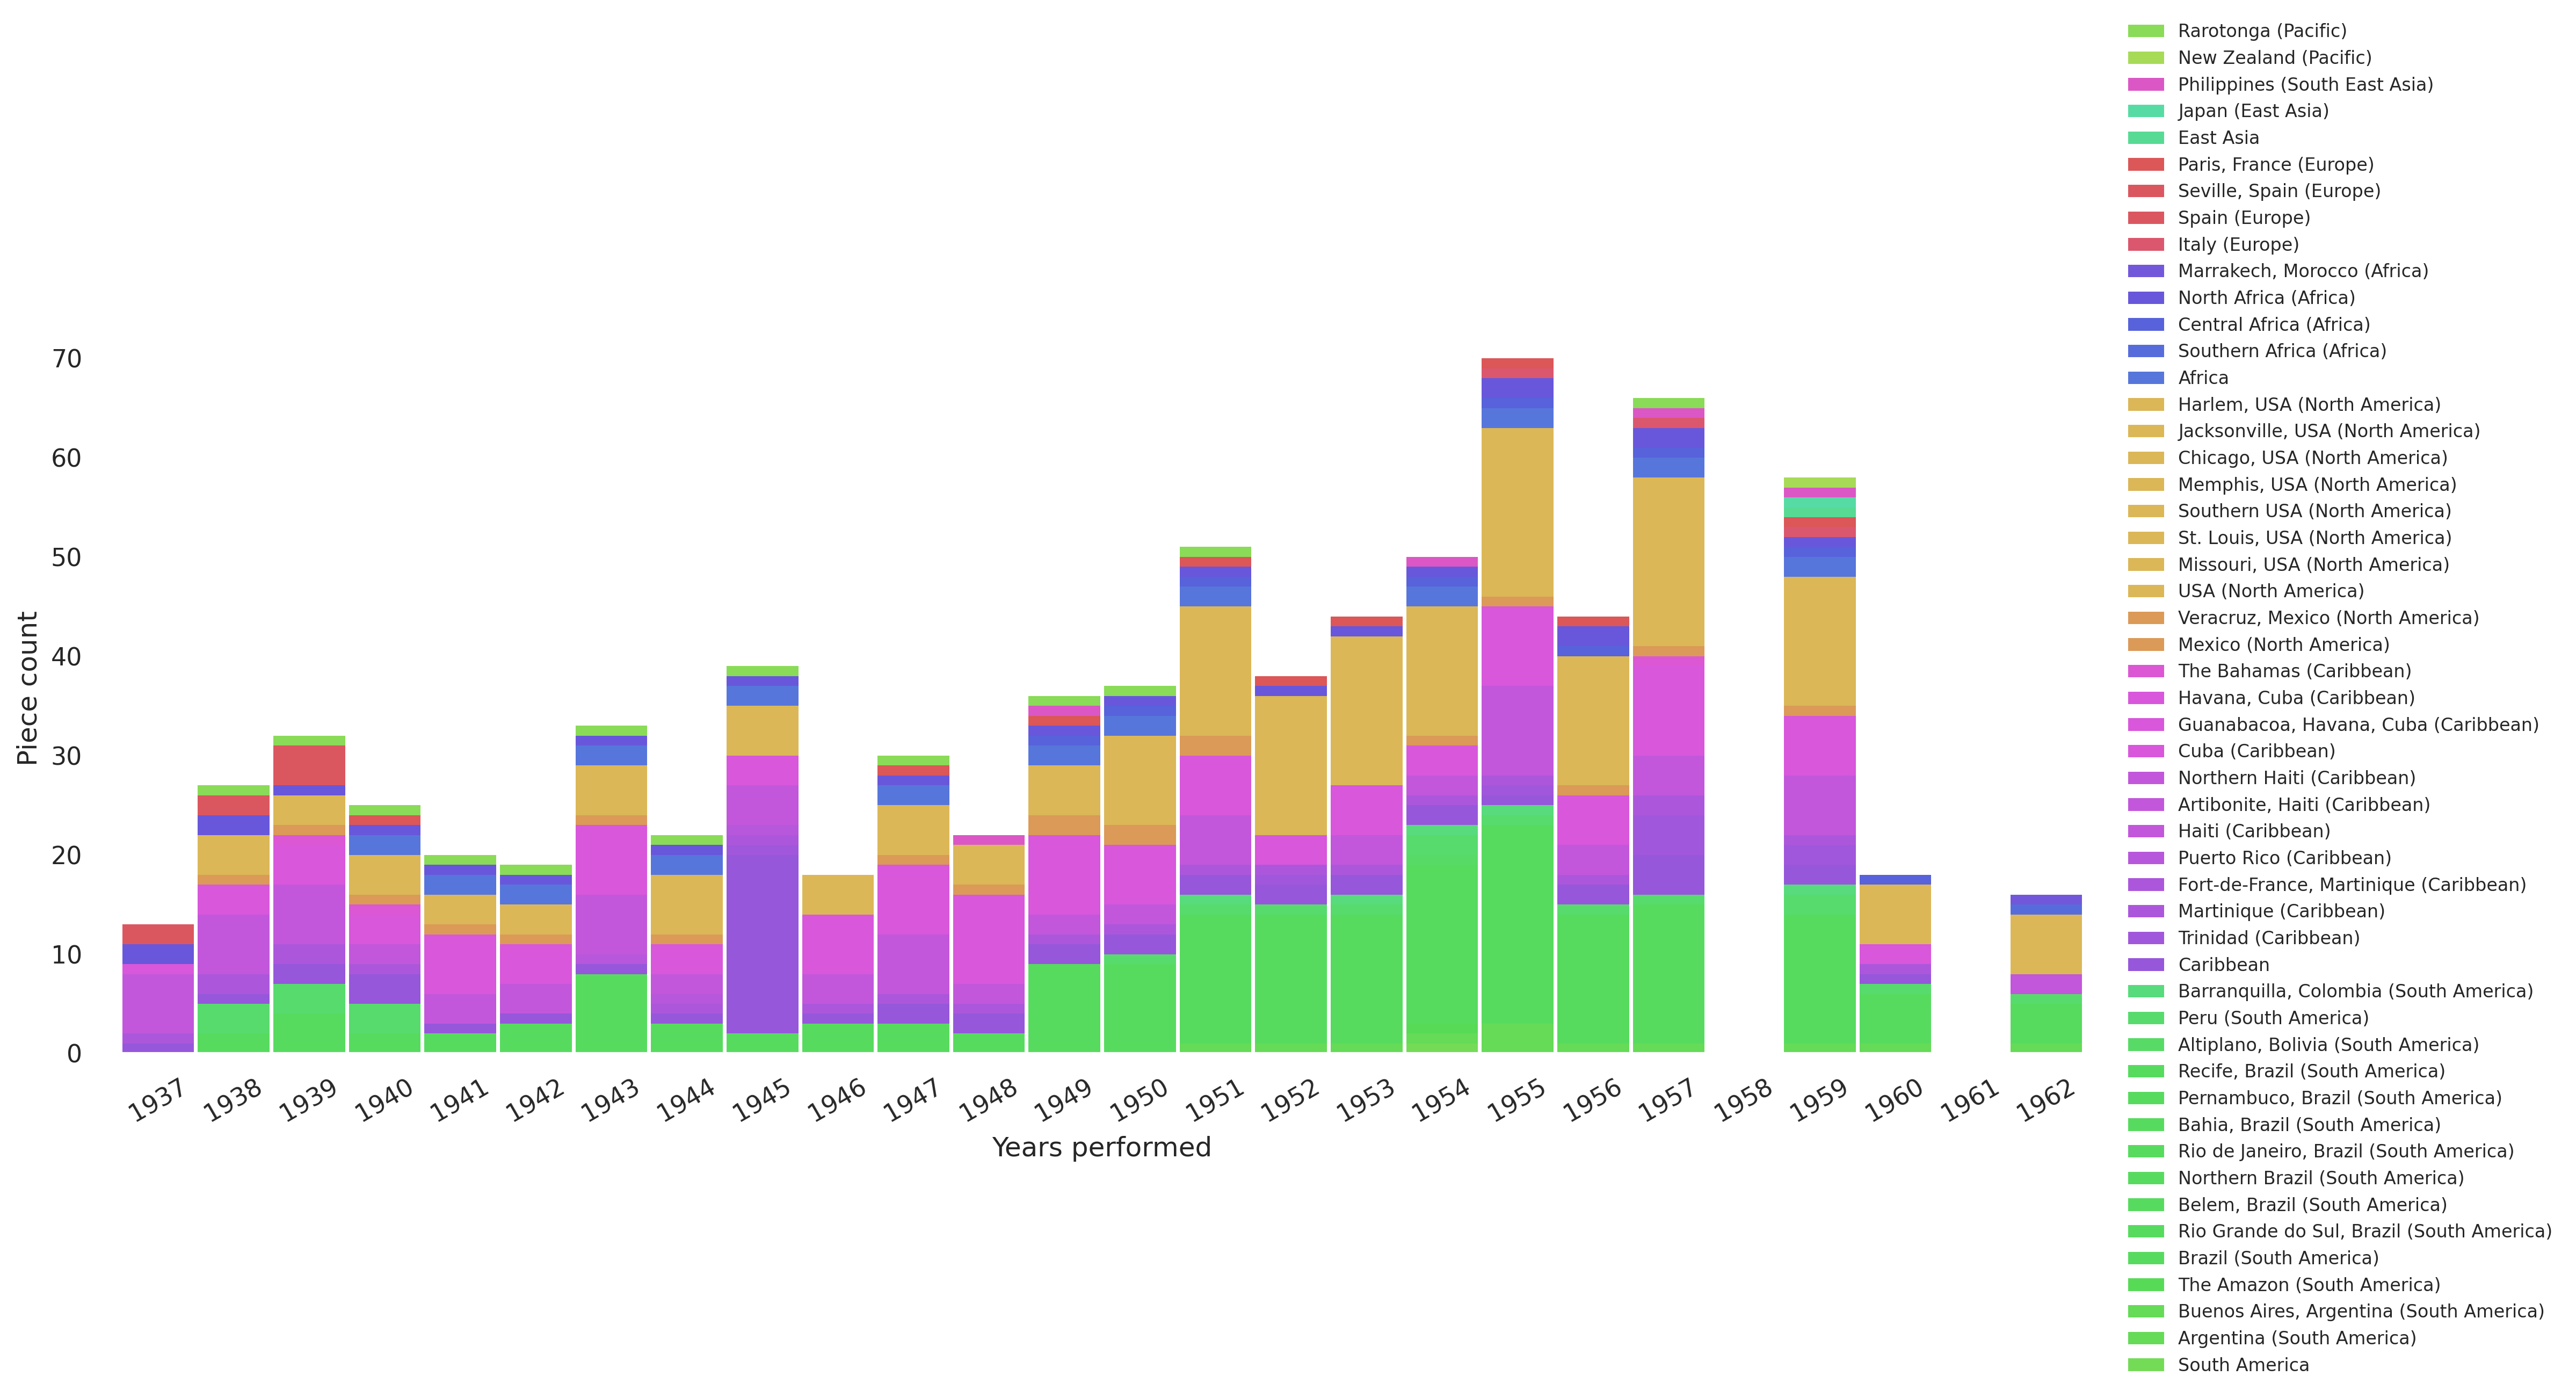
Geographic Repertory Inspiration Graph, 1937-62
This graph shows the proportion of active repertory from 1937-62 inspired by different locations, from cities to entire continents. Coloring is by country. The data is drawn from Katherine Dunham’s program notes, where she articulated the connections between pieces and places.
Data: Harmony Bench, Kate Elswit, and Tia-Monique Uzor. Visualization: Antonio Jiménez Mavillard